The Problem
Star rating is the default lens for judging app quality — but it compresses almost all apps into a narrow 4.2–4.4 band, so it can't tell a PM much about how engaged users actually are. This analysis asks: if rating doesn't separate categories, what does — and what would that tell a PM deciding where to invest in engagement features?
Data & Method
Source: the public Google Play Store apps dataset (App, Category, Rating, Reviews, Installs, Size, Price, Content Rating). Sample: 407 apps across 7 categories — Art & Design, Auto & Vehicles, Beauty, Books & Reference, Business, Comics, and Communication.
Stated limitation: this sample covers 7 of roughly 30 total Play Store categories, so the rankings here are directional, not a definitive market view — and only 3 of 407 apps were Paid, so a Free vs. Paid comparison was excluded as unreliable at that sample size.
The Metric
Review Rate = Reviews ÷ Installs. This estimates what share of a category's install base is engaged enough to leave a review — a proxy for engagement intensity, distinct from Rating, which measures satisfaction rather than engagement.
Segmentation: By Category
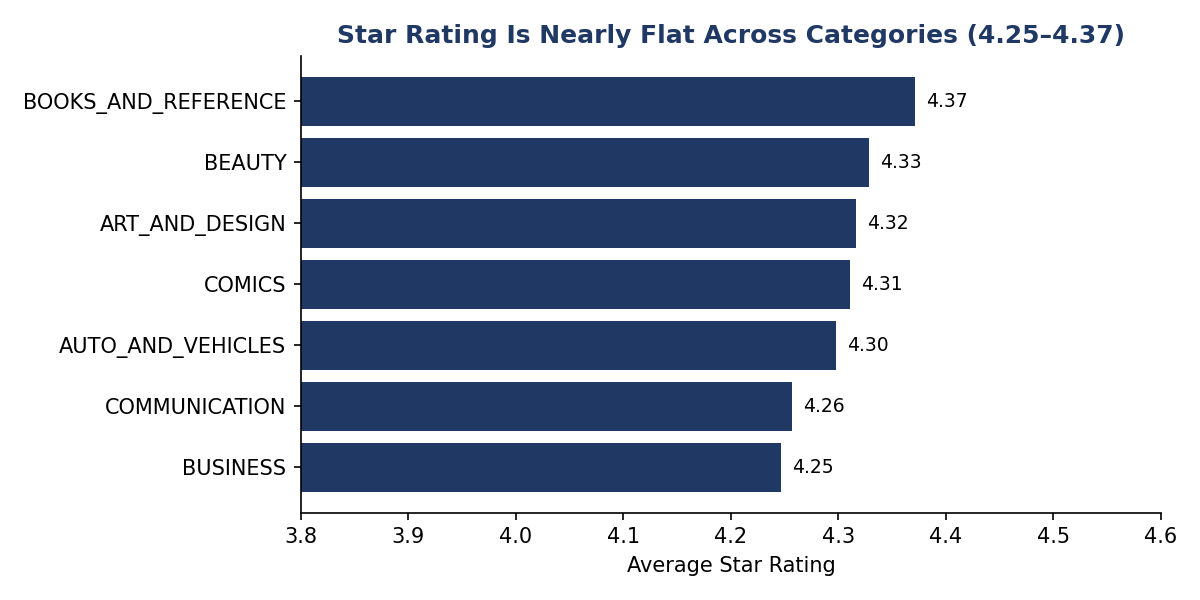
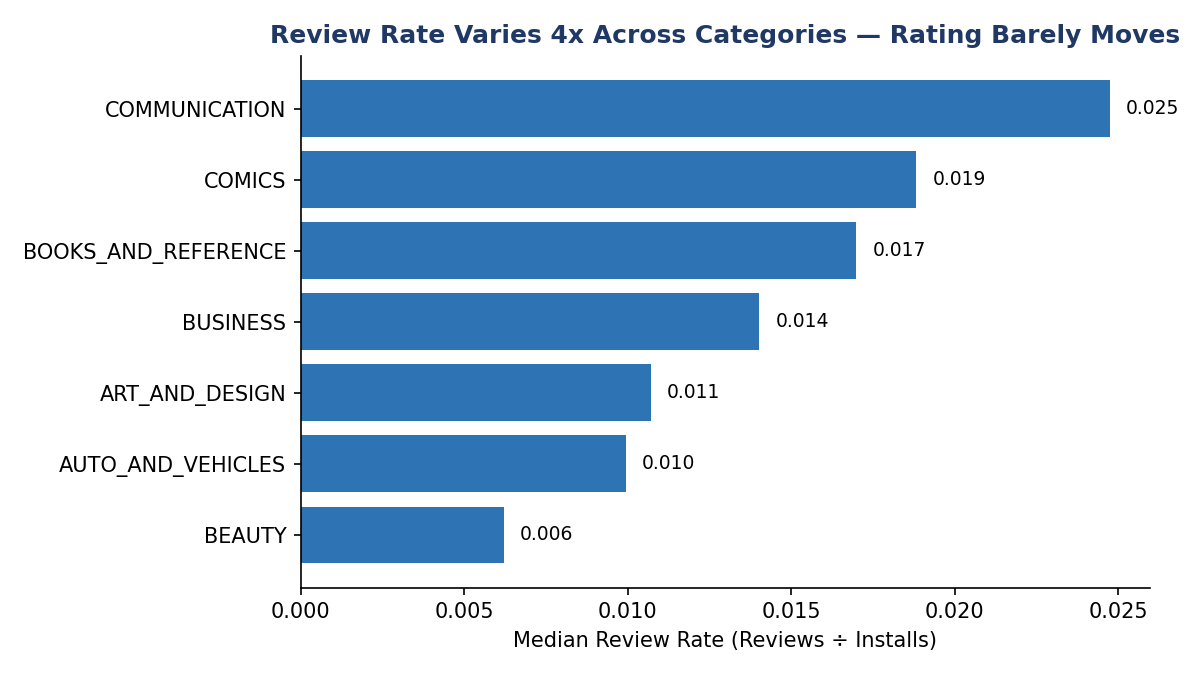
Communication apps sit at 0.025 (roughly 1 review per 40 installs), while Beauty apps sit at 0.006 (roughly 1 review per 160 installs). Rating alone would never have surfaced that gap.
Segmentation: By Install Scale
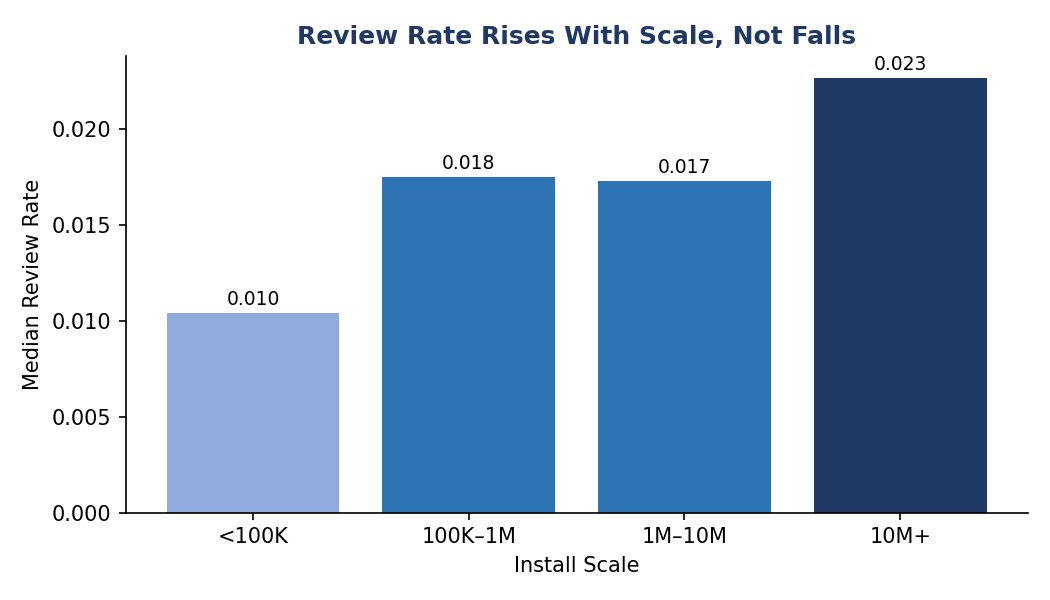
A common assumption is that Review Rate should fall as an app scales, since casual late-adopters are less likely to leave a review than early enthusiasts. This sample shows the opposite — Review Rate is lowest for the smallest apps (<100K installs, 0.010) and highest for the largest (10M+ installs, 0.023).
The Insight
Engagement intensity tracks with how often and how socially an app is used — not with category popularity or install scale alone. Communication apps top both cuts of the data because they're opened many times a day and often carry network effects that naturally prompt a review moment. Beauty and Art & Design apps, by contrast, tend to be single-session utility tools with fewer natural triggers to leave a review, regardless of how large they eventually grow.
Recommendation
- In a naturally low-frequency category, don't use Rating as the engagement scoreboard — track Review Rate (or session frequency) instead, and invest in mechanics that create a reason to reopen the app
- In a high-frequency category approaching the 1M–10M install range specifically, this sample's mid-growth dip is worth investigating with real data before assuming late-stage growth resolves it on its own
- Next step with the full dataset: re-run this segmentation across all ~30 categories to validate the Communication finding isn't driven by a handful of outlier apps